EDASnet
Networked Data Collection
The concept behind EDASnet is to provide Environmental Data
collection systems using distributed computer processing and
saving the results in a standard database format thus making use
of modern computer networking technology.
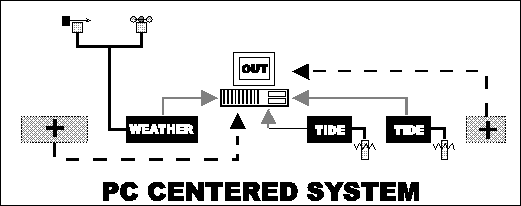
The following diagram describes a typical environmental data
collection system with two Tide Gauges and a Weather Station
directly connected to a single PC, the outlying '+' characters
indicate the logical point to expand the systems, in this case by
making more connections directly to the PC ...

Single PC systems tend to be legacy designs that have evolved
around existing equipment, probably having been added to at
various times in their history and almost certainly the result of
ad hoc software updates and changes. The basic concept of a
single PC acting as a central data collection and display point
has proved to be a very cost effective solution to the problem of
collecting and recording environmental data. These systems
without doubt have proved their reliability in collecting and
storing environmental data, however as computer and information
technologies progress these systems are starting to show their
limitations. With testimony from many users the general problems
areas with these single PC systems are as follows ...
 | Complex software trying to manage all tasks from one thread.
|
|
 | Difficulty in adding more Gauges/Stations to the existing system.
|
|
 | Problems with replacing non-standard serial and A2D cards in PCs.
|
|
 | Limited ability to connect more than two serial port devices.
|
|
 | Problems with running cables through buildings to one computer.
|
|
 | Non-compliance with Year 2000 transition in Software and Hardware.
|
|
 | Timekeeping problems with PC clocks and hardware changes.
|
|
 | Difficulty in updating software to modern graphic operating systems.
|
|
 | Problems with access, backup and presentation of data
collected.
|
|
 | Data not readily available to wide range of potential
users. |
|
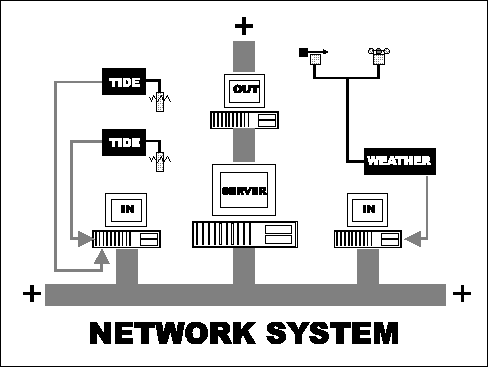
The following diagram outlines the logical design of a system
that performs the same task as the previous single PC system but
is designed around networking principals. As with the previous
diagram the '+' characters indicate the points at which the
system can be expanded ....

From the above diagram it can be seen that the system can be
expanded almost indefinitely by either making connections to
existing PCs or by adding PCs to the network. The single PC
system can actually be simulated using the network model with all
programs (Clients) running on one machine and the interconnecting
network being the internal data bus. In most applications the
network would consist of a number of interconnected computers
using a standard cabling and protocol scheme supported by the
operating system. The location and use of each machine would be
determined by normal constraints such as nearness to peripheral
devices (in this case Tide Gauges and Weather Stations) or by the
power of the machine (e.g. fast machine with large hard disk
would be the data storage and server node). Output nodes would be
computers on the desks of users wishing to see or have access to
the data. Input nodes would be computers running Input Client
programs and connected to the environmental devices either
directly by cable or indirectly by telemetry.

EDASnet - Database
Structure
The major difference between the design of 'single PC' and
the 'Network' Environmental Data collection model is that the
network model has been broken into logical 'components'.
Each component executes as a single task which under modern
operating systems can be run concurrently on the same or
different computers across a network. The main components
identified in a Networked EDAS system are as follows ....
| Input Clients |
These are programs run on machines
directly connected to the input devices (instruments) such
as Tide Gauges and Weather Stations.
These programs capture , filter and pre-process (e.g.
average) the data generated by the connected device.
There are several of these programs, each supporting
different formats and peculiarities of a particular manufacturer's instrument. They all collect the data save
it in a standard database format/table using the database
drivers. Local display is used to present data received,
detected errors in equipment and system errors such as
Server not responding. |
| Data Server |
This is a client interface program
normally referred to as ODBC32 and is supplied as part of,
or as an add-on to the underlying operating system. The
two driver variants currently in use by Lymtech with this server are the Access and/or the SQL server database drivers provided by Microsoft. Local
display of information is provided by the database
product or by using operating system utilities supplied
with the server software. |
| Output Client |
This is a client program which
collects its data from the database via the Data Server
and provides a screen presentation of the data at the
users location. Typically this would be a series of
graphs and numeric windows showing both collected data
and derived data such as average Wind Direction over the
last 10 minutes. These clients can easily be authored by
a software writer as the data provided is in a standard
format and conforms to the WOSA standard as outlined in
the ODBC documentation. |
| Passive Client |
These are programs that can be run anywhere on a network and
listen for a particular message to be transmitted. The message is captured
and displayed, the only user settings being the choice of message and local
display settings. The programs are entirely passive and are not able to
change or access the 'live' data in any way. |
Each of the above software components can be tailored to run
across a network of computers and provide a 'scaleable' system.
By having a distributed system there are several features which
add robustness to the data collection system ..
 | Each node can be designed to fail without causing system
failure. |
|
 | Nodes can be easily replaced, moved, increased or
substituted. |
|
 | Data can be collected over wide area networks. |
|
 | Data can be accessed over wide area networks. |
|
 | Data can be accessed by common office software products. |
|

Data collected using the EDASnet system is saved in a
standard, commercially available database format. Currently this
format uses products which are designed using the Microsoft JET
database engine technology such as Access and SQL server.
The database is a common holding area for a variety of data
sets that can loosely be described as 'Environmental'. Each
parameter has two relational Tables associated with the data
being collected ...
| Data Table |
Actual data collected for each instrument of
this table's type and stored in time series order
|
| Info Table |
Relational information about each instrument
in the set. |
To date there are two major areas of data which have been
addressed by Lymtech and are included within the
database design ...
| Tide Gauge Data |
This includes recorded and predicted
values of tidal elevation at given location coordinates
and includes allowance for basic wave statistics such as
Maximum, Minimum and SD.
|
| Weather Data |
These parameters include Wind (Speed,
Direction and Gust), Barometric Pressure, Air
Temperature, Rainfall, Solarimeter and Relative Humidity. |
Using a database is not the most efficient way of storing
environmental data but it is the best compromise of storing the
information in a structured form and retrieving it a a later
date. With the low cost of modern data storage, the benefits of
being able to retrieve data using database tools such as
Selection and Sorting, then being able to process the data in
commercially available products such as Spreadsheets greatly
outweigh the initial costs of hardware.


| 


![]()
![]()
![]()